- HPA 개념 및 실습2024년 04월 06일
- yeongki0944
- 작성자
- 2024.04.06.:38
[kubernetes.io] Horizontal Pod Autoscaling
[kubernetes.io] HorizontalPodAutoscaler v2 autoscaling - API
[medium] [K8S] Kubernetes의 HPA를 활용한 오토스케일링(Auto Scaling)
Pod Autoscaling
- HPA (Horizontal Pod Autoscaling)
- VPA (Vertical Pod Autoscaling)
Cluster Autoscaling
- CAS (Cluster Autoscaler)
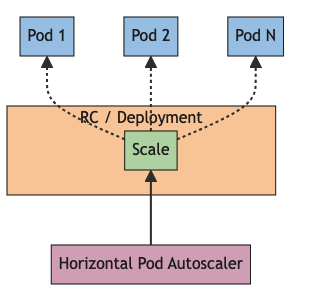
HPA
- 워크로드 리소스(예: 디플로이먼트 또는 스테이트풀셋)를 자동으로 업데이트하며, 워크로드의 크기를 수요에 맞게 자동으로 스케일링하는 것을 목표로 한다.
- Horizontal Pod Autoscaling은 크기 조절이 불가능한 오브젝트(예: 데몬셋)에는 적용할 수 없다.
- HorizontalPodAutoscaler는 쿠버네티스 API 자원 및 컨트롤러 형태로 구현되어 있다.
- 쿠버네티스는 Horizontal Pod Autoscaling을 간헐적으로(intermittently) 실행되는 컨트롤 루프 형태로 구현했다
- 실행 주기는 kube-controller-manager의 --horizontal-pod-autoscaler-sync-period 파라미터에 의해 설정된다(기본 주기는 15초이다).
- 각 주기마다, 컨트롤러 매니저는 각 HorizontalPodAutoscaler 정의에 지정된 메트릭에 대해 리소스 사용률을 질의한다.
- 컨트롤러 매니저는 scaleTargetRef에 의해 정의된 타겟 리소스를 찾고 나서,
타겟 리소스의 .spec.selector 레이블을 보고 파드를 선택하며,
리소스 메트릭 API(파드 단위 리소스 메트릭 용) 또는 커스텀 메트릭 API(그 외 모든 메트릭 용)로부터 메트릭을 수집한다.
[kubernetes.io] Horizontal Pod Autoscaling HPA 알고리즘
원하는 레플리카 수 = ceil[현재 레플리카 수 * ( 현재 메트릭 값 / 원하는 메트릭 값 )]
현재 레플리카수 1 현재 메트릭 값 200m 원하는 메트릭 값 100m ceil( 1 * (200/100) ) = 2
현재 레플리카수 2 현재 메트릭 값 50m 원하는 메트릭 값 100m ceil( 2 * (50/100) ) = 1
<HPA 알고리즘>
- 사용자가 지정한 원하는(desired) 메트릭 값과 현재(current) 메트릭 값 사이의 비율을 계산합니다.
- 현재 메트릭 값이 원하는 값의 배수인지 확인하여 레플리카 수를 결정합니다. 예를 들어, 현재 메트릭 값이 200m이고 원하는 값이 100m인 경우, 레플리카 수가 두 배가 됩니다. 만약 현재 값이 50m인 경우, 레플리카 수는 반으로 줄어듭니다.
- 컨트롤 플레인은 비율이 1.0에 가까울 경우에는 스케일링을 건너 뛸 수 있습니다.
- targetAverageValue 또는 targetAverageUtilization가 지정되면, 해당 메트릭의 평균을 계산하여 사용합니다.
- 누락된 메트릭이나 준비되지 않은 파드를 고려하여 평균을 재계산합니다.
- CPU를 스케일할 때, 초기화된 파드와 준비되지 않은 파드를 고려하여 처리합니다.
- 누락된 메트릭이나 준비되지 않은 파드가 있는 경우, 이를 보수적으로 고려하여 평균을 다시 계산합니다.
- 여러 메트릭이 지정된 경우, 각 메트릭에 대해 계산된 레플리카 수 중 가장 큰 값을 선택합니다.
- 모든 계산을 마치고나서 스케일 권장 사항을 기록하고, 구성 가능한 창 내에서 가장 높은 값을 선택하여 스케일을 진행합니다.
HPA Scale 정책 설정
[medium] [K8S] Kubernetes의 HPA를 활용한 오토스케일링(Auto Scaling)
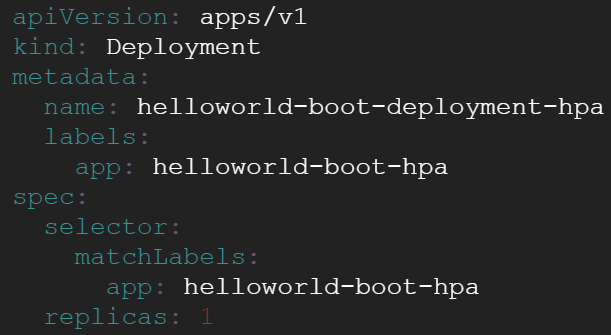
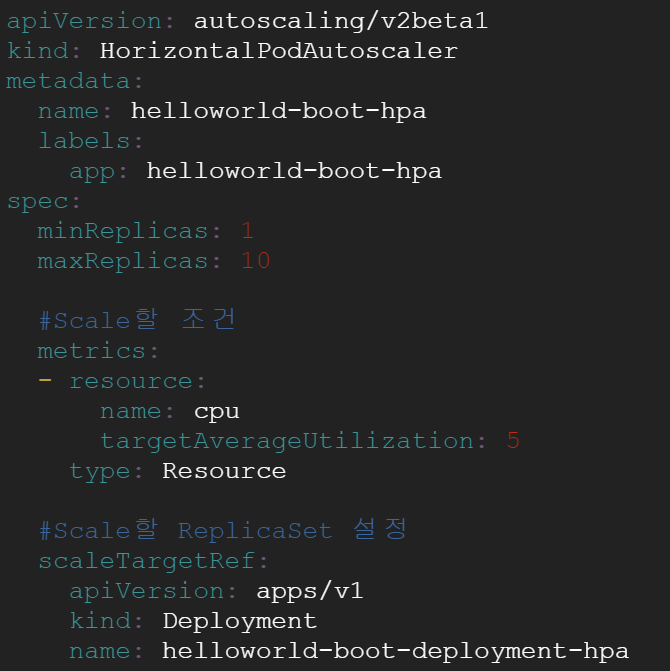
HPA 실습
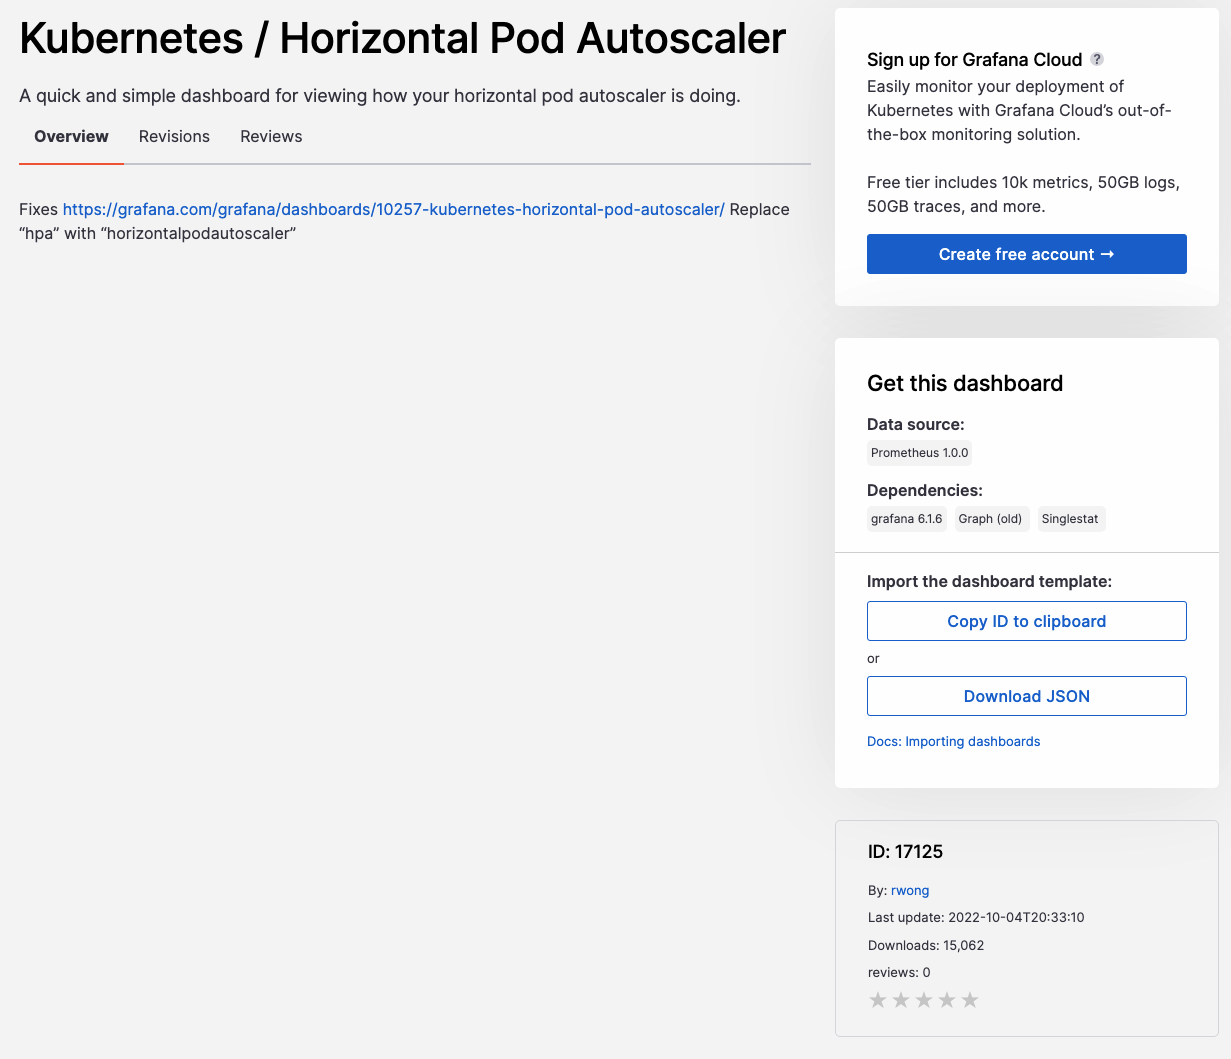
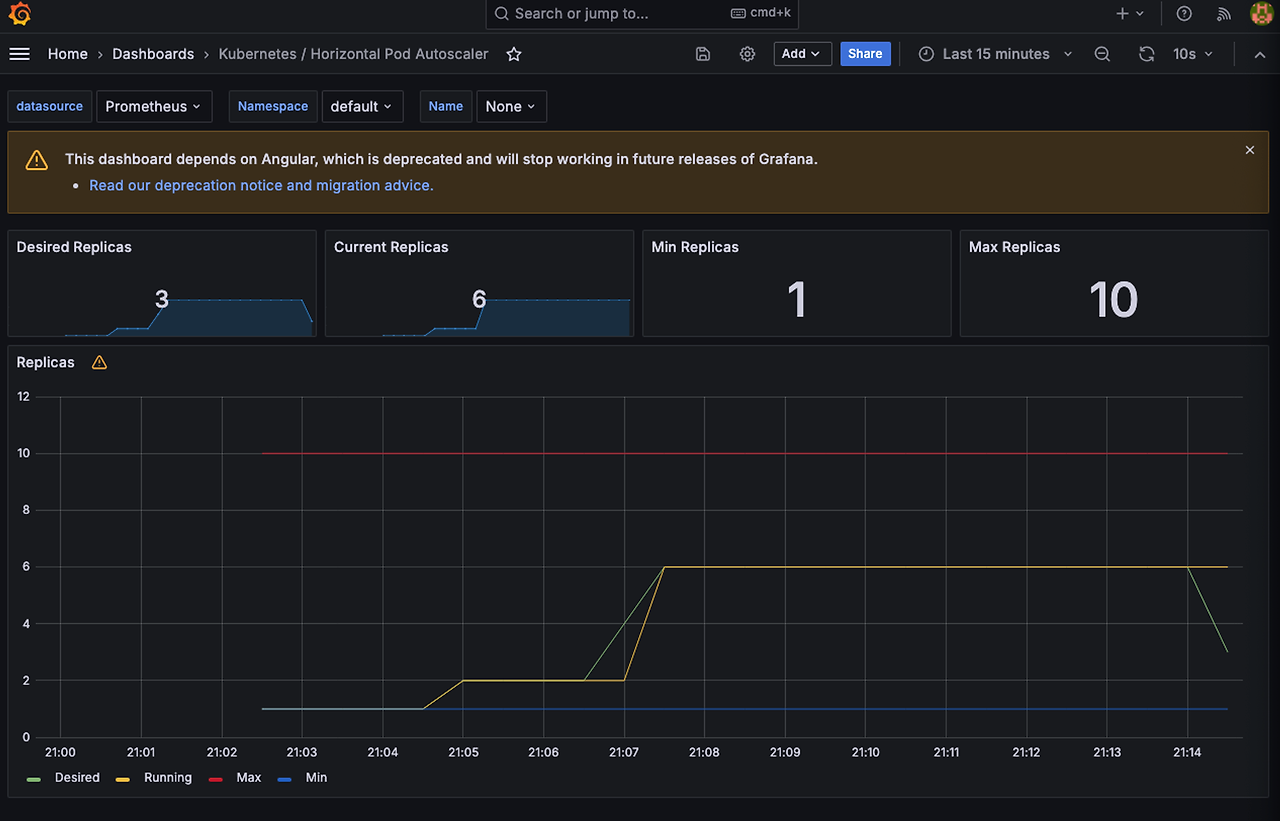
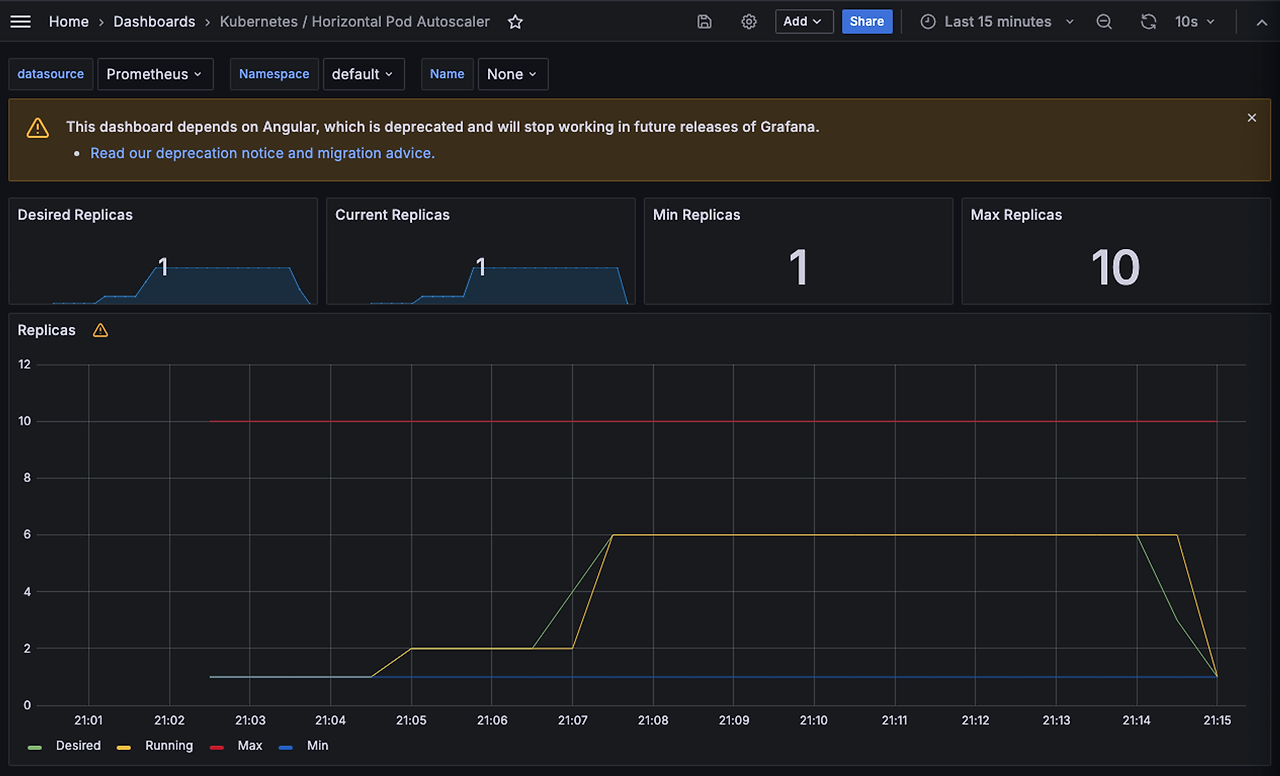
Grafana - Dashboard 17125
{
  "__inputs": [],
  "__requires": [
    {
      "type": "grafana",
      "id": "grafana",
      "name": "Grafana",
      "version": "6.1.6"
    },
    {
      "type": "panel",
      "id": "graph",
      "name": "Graph",
      "version": ""
    },
    {
      "type": "datasource",
      "id": "prometheus",
      "name": "Prometheus",
      "version": "1.0.0"
    },
    {
      "type": "panel",
      "id": "singlestat",
      "name": "Singlestat",
      "version": ""
    }
  ],
  "annotations": {
    "list": [
      {
        "builtIn": 1,
        "datasource": "-- Grafana --",
        "enable": true,
        "hide": true,
        "iconColor": "rgba(0, 211, 255, 1)",
        "name": "Annotations & Alerts",
        "type": "dashboard"
      }
    ]
  },
  "editable": true,
  "gnetId": 17125,
  "graphTooltip": 0,
  "id": null,
  "iteration": 1558717029334,
  "links": [],
  "panels": [
    {
      "cacheTimeout": null,
      "colorBackground": false,
      "colorValue": false,
      "colors": [
        "#299c46",
        "rgba(237, 129, 40, 0.89)",
        "#d44a3a"
      ],
      "datasource": "$datasource",
      "format": "none",
      "gauge": {
        "maxValue": 100,
        "minValue": 0,
        "show": false,
        "thresholdLabels": false,
        "thresholdMarkers": true
      },
      "id": 5,
      "interval": null,
      "links": [],
      "mappingType": 1,
      "mappingTypes": [
        {
          "name": "value to text",
          "value": 1
        },
        {
          "name": "range to text",
          "value": 2
        }
      ],
      "maxDataPoints": 100,
      "nullPointMode": "connected",
      "nullText": null,
      "postfix": "",
      "postfixFontSize": "50%",
      "prefix": "",
      "prefixFontSize": "50%",
      "rangeMaps": [
        {
          "from": "null",
          "text": "N/A",
          "to": "null"
        }
      ],
      "sparkline": {
        "fillColor": "rgba(31, 118, 189, 0.18)",
        "full": false,
        "lineColor": "rgb(31, 120, 193)",
        "show": true
      },
      "tableColumn": "",
      "targets": [
        {
          "expr": "kube_horizontalpodautoscaler_status_desired_replicas{job=\"kube-state-metrics\", namespace=\"$namespace\"}",
          "format": "time_series",
          "intervalFactor": 2,
          "legendFormat": "",
          "refId": "A"
        }
      ],
      "thresholds": "",
      "title": "Desired Replicas",
      "type": "singlestat",
      "valueFontSize": "80%",
      "valueMaps": [
        {
          "op": "=",
          "text": "0",
          "value": "null"
        }
      ],
      "valueName": "current"
    },
    {
      "cacheTimeout": null,
      "colorBackground": false,
      "colorValue": false,
      "colors": [
        "#299c46",
        "rgba(237, 129, 40, 0.89)",
        "#d44a3a"
      ],
      "datasource": "$datasource",
      "format": "none",
      "gauge": {
        "maxValue": 100,
        "minValue": 0,
        "show": false,
        "thresholdLabels": false,
        "thresholdMarkers": true
      },
      "gridPos": {
        "h": 3,
        "w": 6,
        "x": 6,
        "y": 0
      },
      "id": 6,
      "interval": null,
      "links": [],
      "mappingType": 1,
      "mappingTypes": [
        {
          "name": "value to text",
          "value": 1
        },
        {
          "name": "range to text",
          "value": 2
        }
      ],
      "maxDataPoints": 100,
      "nullPointMode": "connected",
      "nullText": null,
      "postfix": "",
      "postfixFontSize": "50%",
      "prefix": "",
      "prefixFontSize": "50%",
      "rangeMaps": [
        {
          "from": "null",
          "text": "N/A",
          "to": "null"
        }
      ],
      "sparkline": {
        "fillColor": "rgba(31, 118, 189, 0.18)",
        "full": false,
        "lineColor": "rgb(31, 120, 193)",
        "show": true
      },
      "tableColumn": "",
      "targets": [
        {
          "expr": "kube_horizontalpodautoscaler_status_current_replicas{job=\"kube-state-metrics\", namespace=\"$namespace\"}",
          "format": "time_series",
          "intervalFactor": 2,
          "legendFormat": "",
          "refId": "A"
        }
      ],
      "thresholds": "",
      "title": "Current Replicas",
      "type": "singlestat",
      "valueFontSize": "80%",
      "valueMaps": [
        {
          "op": "=",
          "text": "0",
          "value": "null"
        }
      ],
      "valueName": "current"
    },
    {
      "cacheTimeout": null,
      "colorBackground": false,
      "colorValue": false,
      "colors": [
        "#299c46",
        "rgba(237, 129, 40, 0.89)",
        "#d44a3a"
      ],
      "datasource": "$datasource",
      "format": "none",
      "gauge": {
        "maxValue": 100,
        "minValue": 0,
        "show": false,
        "thresholdLabels": false,
        "thresholdMarkers": true
      },
      "gridPos": {
        "h": 3,
        "w": 6,
        "x": 12,
        "y": 0
      },
      "id": 7,
      "interval": null,
      "links": [],
      "mappingType": 1,
      "mappingTypes": [
        {
          "name": "value to text",
          "value": 1
        },
        {
          "name": "range to text",
          "value": 2
        }
      ],
      "maxDataPoints": 100,
      "nullPointMode": "connected",
      "nullText": null,
      "postfix": "",
      "postfixFontSize": "50%",
      "prefix": "",
      "prefixFontSize": "50%",
      "rangeMaps": [
        {
          "from": "null",
          "text": "N/A",
          "to": "null"
        }
      ],
      "sparkline": {
        "fillColor": "rgba(31, 118, 189, 0.18)",
        "full": false,
        "lineColor": "rgb(31, 120, 193)",
        "show": false
      },
      "tableColumn": "",
      "targets": [
        {
          "expr": "kube_horizontalpodautoscaler_spec_min_replicas{job=\"kube-state-metrics\",  namespace=\"$namespace\"}",
          "format": "time_series",
          "intervalFactor": 2,
          "legendFormat": "",
          "refId": "A"
        }
      ],
      "thresholds": "",
      "title": "Min Replicas",
      "type": "singlestat",
      "valueFontSize": "80%",
      "valueMaps": [
        {
          "op": "=",
          "text": "0",
          "value": "null"
        }
      ],
      "valueName": "current"
    },
    {
      "cacheTimeout": null,
      "colorBackground": false,
      "colorValue": false,
      "colors": [
        "#299c46",
        "rgba(237, 129, 40, 0.89)",
        "#d44a3a"
      ],
      "datasource": "$datasource",
      "format": "none",
      "gauge": {
        "maxValue": 100,
        "minValue": 0,
        "show": false,
        "thresholdLabels": false,
        "thresholdMarkers": true
      },
      "gridPos": {
        "h": 3,
        "w": 6,
        "x": 18,
        "y": 0
      },
      "id": 8,
      "interval": null,
      "links": [],
      "mappingType": 1,
      "mappingTypes": [
        {
          "name": "value to text",
          "value": 1
        },
        {
          "name": "range to text",
          "value": 2
        }
      ],
      "maxDataPoints": 100,
      "nullPointMode": "connected",
      "nullText": null,
      "postfix": "",
      "postfixFontSize": "50%",
      "prefix": "",
      "prefixFontSize": "50%",
      "rangeMaps": [
        {
          "from": "null",
          "text": "N/A",
          "to": "null"
        }
      ],
      "sparkline": {
        "fillColor": "rgba(31, 118, 189, 0.18)",
        "full": false,
        "lineColor": "rgb(31, 120, 193)",
        "show": false
      },
      "tableColumn": "",
      "targets": [
        {
          "expr": "kube_horizontalpodautoscaler_spec_max_replicas{job=\"kube-state-metrics\"}",
          "format": "time_series",
          "intervalFactor": 2,
          "legendFormat": "",
          "refId": "A"
        }
      ],
      "thresholds": "",
      "title": "Max Replicas",
      "type": "singlestat",
      "valueFontSize": "80%",
      "valueMaps": [
        {
          "op": "=",
          "text": "0",
          "value": "null"
        }
      ],
      "valueName": "current"
    },
    {
      "aliasColors": {},
      "bars": false,
      "dashLength": 10,
      "dashes": false,
      "datasource": "$datasource",
      "fill": 0,
      "gridPos": {
        "h": 12,
        "w": 24,
        "x": 0,
        "y": 3
      },
      "id": 9,
      "legend": {
        "alignAsTable": false,
        "avg": false,
        "current": false,
        "max": false,
        "min": false,
        "rightSide": false,
        "show": true,
        "total": false,
        "values": false
      },
      "lines": true,
      "linewidth": 1,
      "links": [],
      "nullPointMode": "null",
      "paceLength": 10,
      "percentage": false,
      "pointradius": 5,
      "points": false,
      "renderer": "flot",
      "repeat": null,
      "seriesOverrides": [
        {
          "alias": "Max",
          "color": "#C4162A"
        },
        {
          "alias": "Min",
          "color": "#1F60C4"
        }
      ],
      "spaceLength": 10,
      "stack": false,
      "steppedLine": false,
      "targets": [
        {
          "expr": "kube_horizontalpodautoscaler_status_desired_replicas{job=\"kube-state-metrics\",namespace=\"$namespace\"}",
          "format": "time_series",
          "intervalFactor": 2,
          "legendFormat": "Desired",
          "refId": "B"
        },
        {
          "expr": "kube_horizontalpodautoscaler_status_current_replicas{job=\"kube-state-metrics\",namespace=\"$namespace\"}",
          "format": "time_series",
          "intervalFactor": 2,
          "legendFormat": "Running",
          "refId": "C"
        },
        {
          "expr": "kube_horizontalpodautoscaler_spec_max_replicas{job=\"kube-state-metrics\",namespace=\"$namespace\"}",
          "format": "time_series",
          "instant": false,
          "intervalFactor": 2,
          "legendFormat": "Max",
          "refId": "A"
        },
        {
          "expr": "kube_horizontalpodautoscaler_spec_min_replicas{job=\"kube-state-metrics\",namespace=\"$namespace\"}",
          "format": "time_series",
          "instant": false,
          "intervalFactor": 2,
          "legendFormat": "Min",
          "refId": "D"
        }
      ],
      "thresholds": [],
      "timeFrom": null,
      "timeRegions": [],
      "timeShift": null,
      "title": "Replicas",
      "tooltip": {
        "shared": true,
        "sort": 0,
        "value_type": "individual"
      },
      "type": "graph",
      "xaxis": {
        "buckets": null,
        "mode": "time",
        "name": null,
        "show": true,
        "values": []
      },
      "yaxes": [
        {
          "format": "short",
          "label": null,
          "logBase": 1,
          "max": null,
          "min": null,
          "show": true
        },
        {
          "format": "short",
          "label": null,
          "logBase": 1,
          "max": null,
          "min": null,
          "show": true
        }
      ],
      "yaxis": {
        "align": false,
        "alignLevel": null
      }
    }
  ],
  "refresh": "10s",
  "schemaVersion": 18,
  "style": "dark",
  "tags": [],
  "templating": {
    "list": [
      {
        "current": {
          "text": "Prometheus",
          "value": "Prometheus"
        },
        "hide": 0,
        "includeAll": false,
        "label": null,
        "multi": false,
        "name": "datasource",
        "options": [],
        "query": "prometheus",
        "refresh": 1,
        "regex": "",
        "skipUrlSync": false,
        "type": "datasource"
      },
      {
        "allValue": null,
        "current": {},
        "datasource": "$datasource",
        "definition": "label_values(kube_horizontalpodautoscaler_metadata_generation{job=\"kube-state-metrics\"}, namespace)",
        "hide": 0,
        "includeAll": false,
        "label": "Namespace",
        "multi": false,
        "name": "namespace",
        "options": [],
        "query": "label_values(kube_horizontalpodautoscaler_metadata_generation{job=\"kube-state-metrics\"}, namespace)",
        "refresh": 2,
        "regex": "",
        "skipUrlSync": false,
        "sort": 0,
        "tagValuesQuery": "",
        "tags": [],
        "tagsQuery": "",
        "type": "query",
        "useTags": false
      },
      {
        "allValue": null,
        "current": {},
        "datasource": "$datasource",
        "definition": "label_values(kube_horizontalpodautoscaler_labels{job=\"kube-state-metrics\", namespace=\"$namespace\"}, horizontalpodautoscaler)",
        "hide": 0,
        "includeAll": false,
        "label": "Name",
        "multi": false,
        "name": "horizontalpodautoscaler",
        "options": [],
        "query": "label_values(kube_horizontalpodautoscaler_labels{job=\"kube-state-metrics\", namespace=\"$namespace\"}, horizontalpodautoscaler)",
        "refresh": 2,
        "regex": "",
        "skipUrlSync": false,
        "sort": 0,
        "tagValuesQuery": "",
        "tags": [],
        "tagsQuery": "",
        "type": "query",
        "useTags": false
      }
    ]
  },
  "time": {
    "from": "now-1h",
    "to": "now"
  },
  "timepicker": {
    "refresh_intervals": [
      "5s",
      "10s",
      "30s",
      "1m",
      "5m",
      "15m",
      "30m",
      "1h",
      "2h",
      "1d"
    ],
    "time_options": [
      "5m",
      "15m",
      "1h",
      "6h",
      "12h",
      "24h",
      "2d",
      "7d",
      "30d"
    ]
  },
  "timezone": "",
  "title": "Kubernetes / Horizontal Pod Autoscaler",
  "uid": "alJY6yWZz",
  "version": 10,
  "description": "A quick and simple dashboard for viewing how your horizontal pod autoscaler is doing."
}
# Run and expose php-apache server curl -s -O https://raw.githubusercontent.com/kubernetes/website/main/content/en/examples/application/php-apache.yaml cat php-apache.yaml | yh kubectl apply -f php-apache.yaml # 확인 kubectl exec -it deploy/php-apache -- cat /var/www/html/index.php ... # 모니터링 : 터미널2개 사용 watch -d 'kubectl get hpa,pod;echo;kubectl top pod;echo;kubectl top node' kubectl exec -it deploy/php-apache -- top # 접속 PODIP=$(kubectl get pod -l run=php-apache -o jsonpath={.items[0].status.podIP}) curl -s $PODIP; echo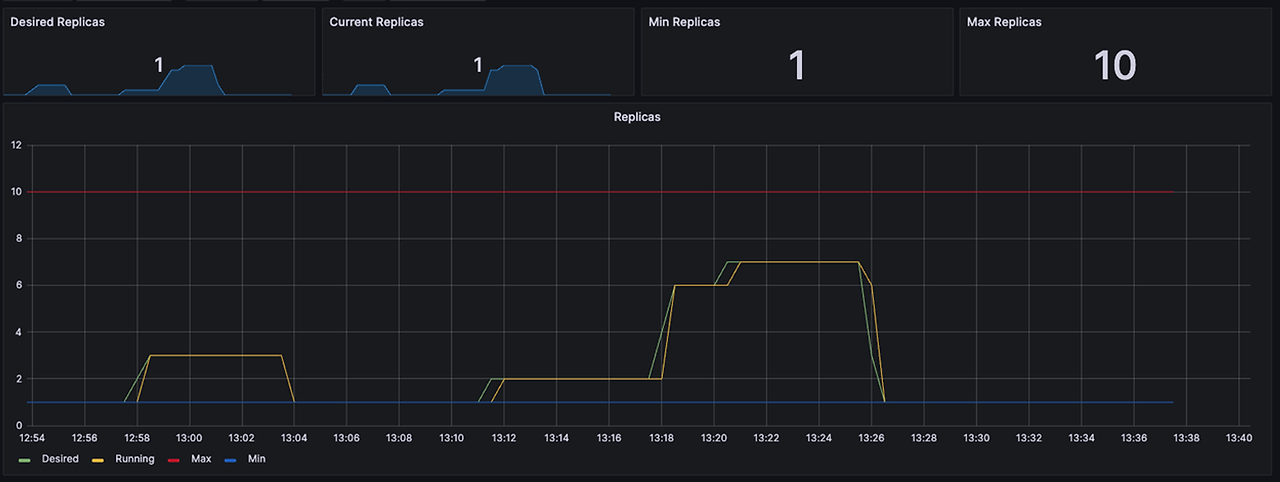
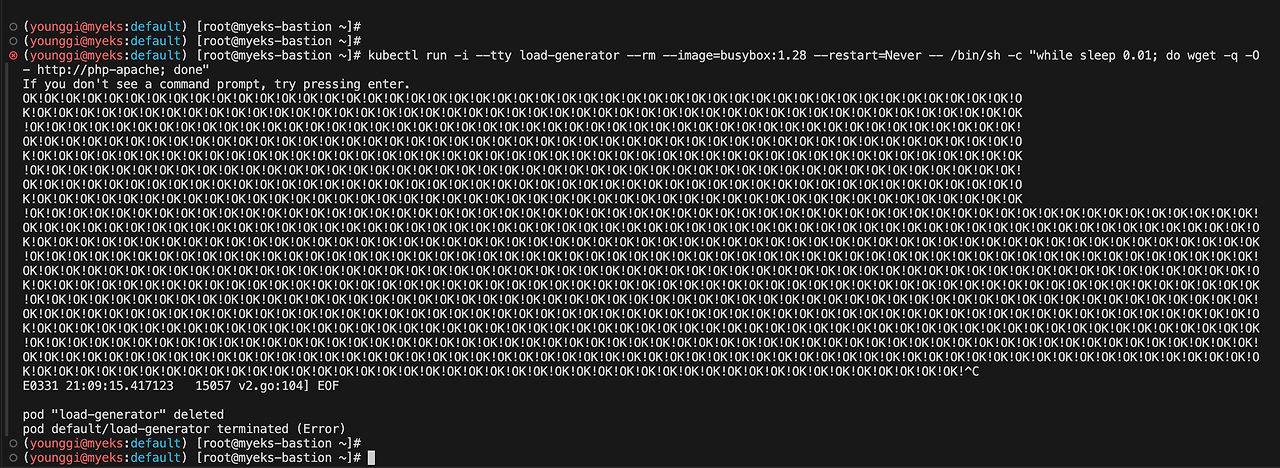
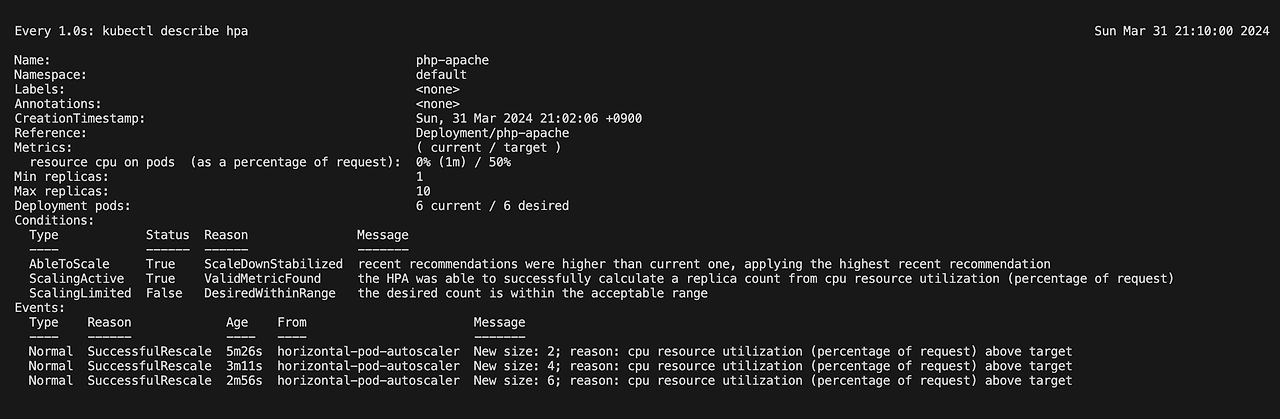
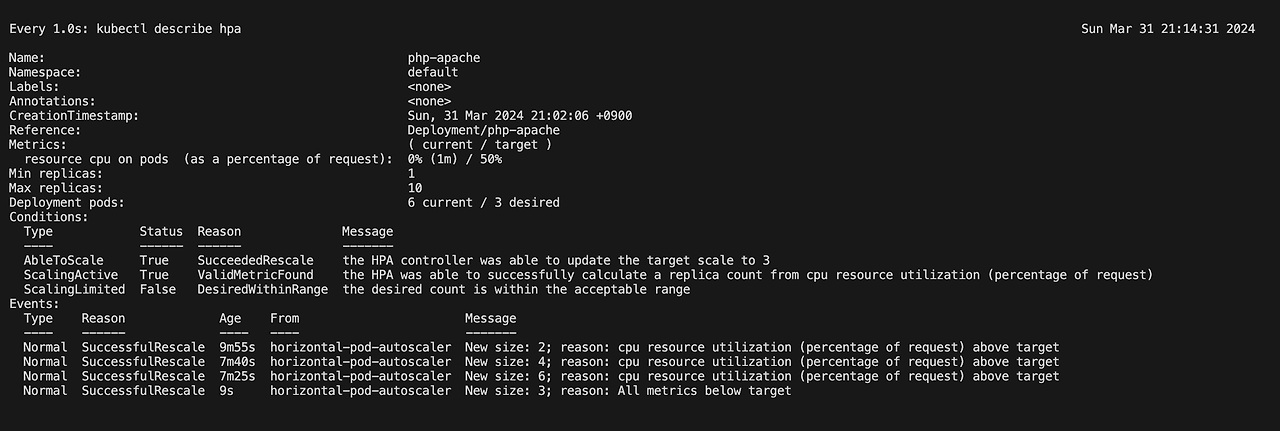
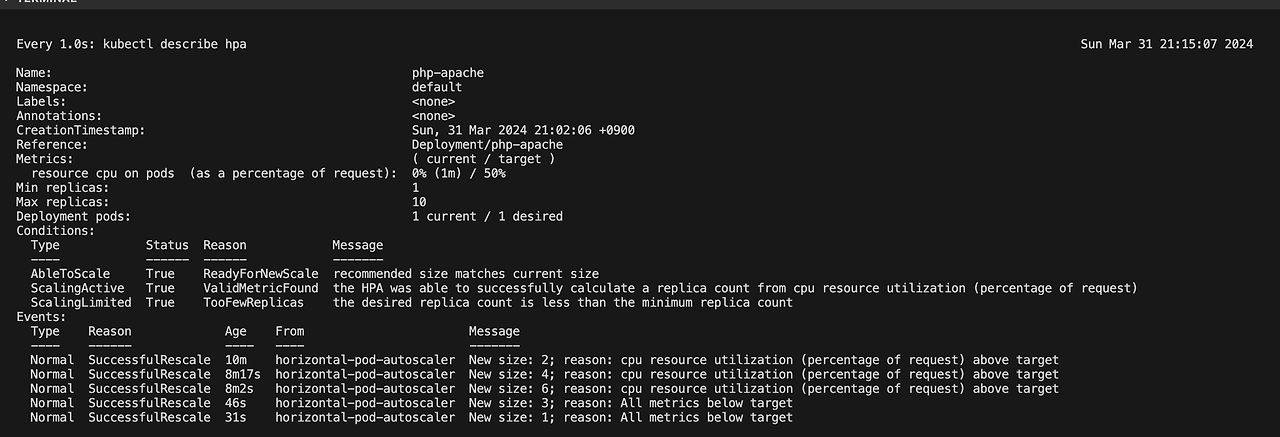
# HPA 설정 확인
kubectl get hpa php-apache -o yaml | kubectl neat | yh
spec:
  minReplicas: 1               # [4] 또는 최소 1개까지 줄어들 수도 있습니다
  maxReplicas: 10              # [3] 포드를 최대 5개까지 늘립니다
  scaleTargetRef:
    apiVersion: apps/v1
    kind: Deployment
    name: php-apache           # [1] php-apache 의 자원 사용량에서
  metrics:
  - type: Resource
    resource:
      name: cpu
      target:
        type: Utilization
        averageUtilization: 50  # [2] CPU 활용률이 50% 이상인 경우

# 반복 접속 1 (파드1 IP로 접속) >> 증가 확인 후 중지
while true;do curl -s $PODIP; sleep 0.5; done

# 반복 접속 2 (서비스명 도메인으로 접속) >> 증가 확인(몇개까지 증가되는가? 그 이유는?) 후 중지 >> 중지 5분 후 파드 갯수 감소 확인
# Run this in a separate terminal
# so that the load generation continues and you can carry on with the rest of the steps
kubectl run -i --tty load-generator --rm --image=busybox:1.28 --restart=Never -- /bin/sh -c "while sleep 0.01; do wget -q -O- http://php-apache; done"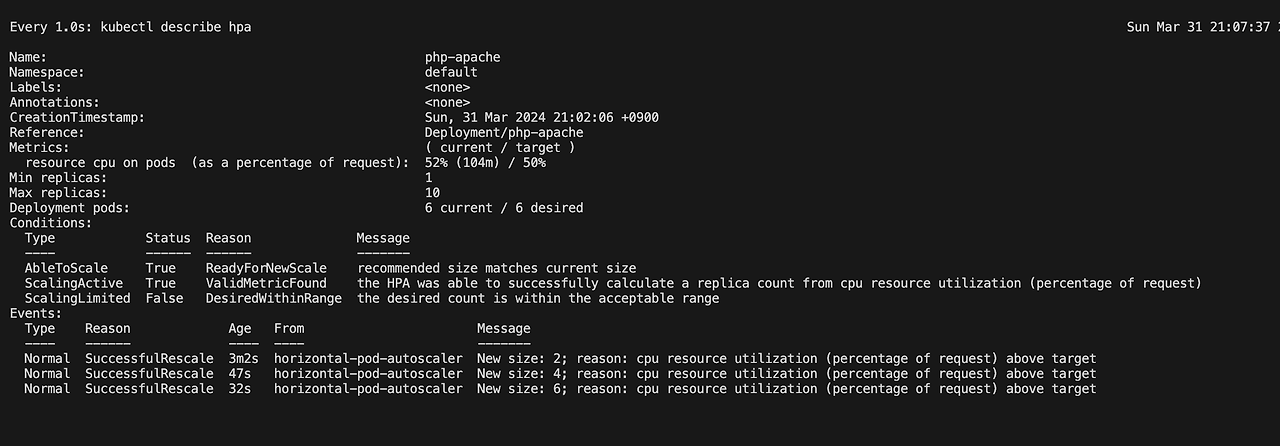
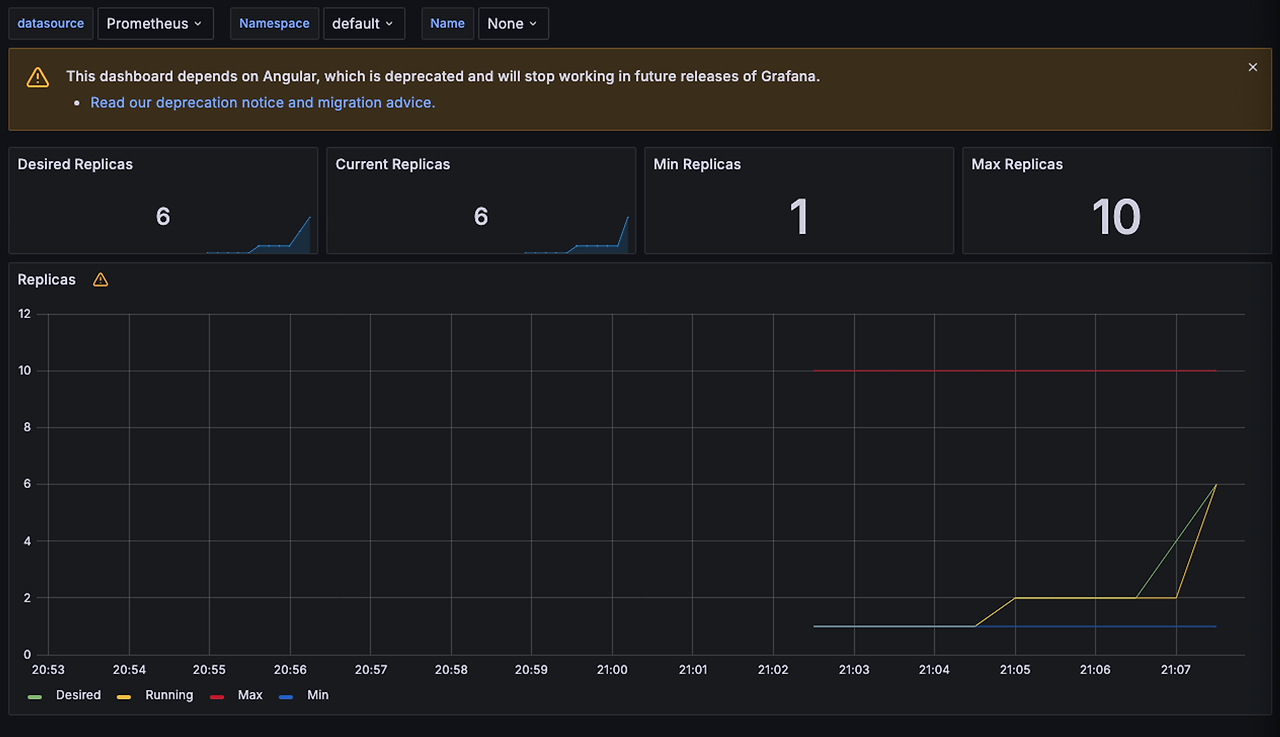
stop
5분 지난 뒤에 Scale in
# 오브젝트 삭제 kubectl delete deploy,svc,hpa,pod --all다음글이전글이전 글이 없습니다.댓글
스킨 업데이트 안내
현재 이용하고 계신 스킨의 버전보다 더 높은 최신 버전이 감지 되었습니다. 최신버전 스킨 파일을 다운로드 받을 수 있는 페이지로 이동하시겠습니까?
("아니오" 를 선택할 시 30일 동안 최신 버전이 감지되어도 모달 창이 표시되지 않습니다.)